Scale the rollouts
Each reported RL step uses 1,568 prompts with 16 rollouts each: 25,088 trajectories and 2.7–3.7B training tokens. Pro and Flash RL costs are reported as about $2.6M and $0.9M. §4.1, p. 8.
A public survey and pre-read guide. Each entry points to a verified source, a stored PDF, the figures that matter, and questions to answer from memory. The diagrams remain yours to reshape in draw.io.
LLM-Core Xiaomi · technical report · 44 pages · reviewed 27 Sep 2026
Take-home message
Large agentic RL in this report is a systems recipe: more rollout throughput, more varied tasks and harnesses, and better grading signals must work together with stability controls.
The stored Drive copy allows anyone with its link to view this report. The reviewed PDF's SHA-256 begins fb81e6e08380.
Each reported RL step uses 1,568 prompts with 16 rollouts each: 25,088 trajectories and 2.7–3.7B training tokens. Pro and Flash RL costs are reported as about $2.6M and $0.9M. §4.1, p. 8.
The task mix covers code, general tools, visual design, context following, and cybersecurity. Multi-harness code training is tested on held-out harnesses. §5.1, p. 20; Figure 10, p. 23.
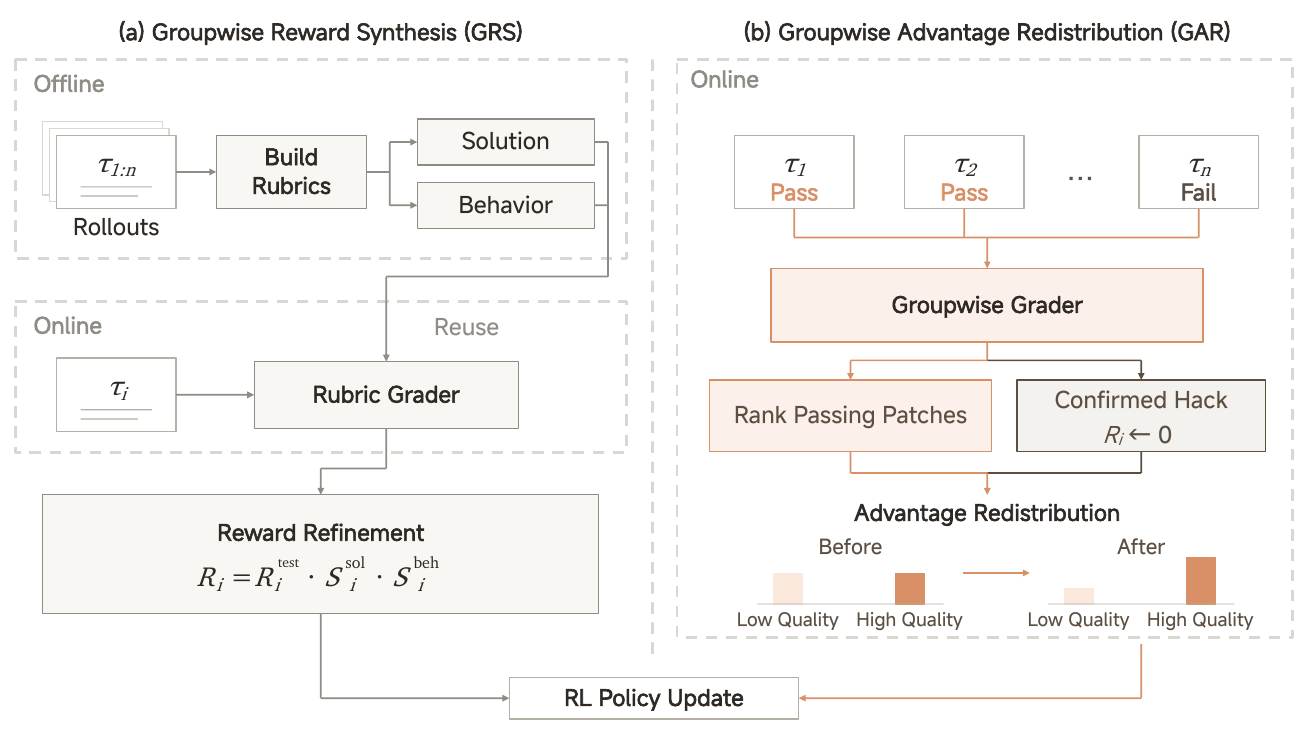
GRS makes task-specific rubrics offline; GAR compares passing and failing trajectories online, then shifts advantage toward better passing solutions. §4.3; Figure 7, p. 17.
Use the guide as a prediction to test, then correct it from the paper.
Open the PDF at the printed page; redraw Figure 7 without looking back.
DeepSWE average@3 rises Pro 58.4→72.6 and Flash 48.7→65.7 over the reported run. Inspect the cost split too.
Increasing cost accompanies several simultaneous changes.
GRS: offline rollouts → solution/behavior rubrics → per-rollout scores. GAR: online group comparison → hack check → advantage redistribution.
This is a mechanism diagram, not an efficacy experiment.
In code-only RL, online grading accompanies steadier turns/token lengths and sustained pass-rate gains.
Separate setting with batch size 128, not the full mixed-task run.
Follow benchmark scores and token counts; then held-out harness Pass@1; then expert load with and without router freeze.
Average@3, Pass@1, and avg@n are different metrics.
A compressed map for draw.io. The arrows describe the training flow; the reported figures test selected parts of it.
In your own map, add the environment, grader, control/data plane, and evaluation as separate branches. Label observed benchmark changes beside the diagram, rather than turning them into mechanism arrows.
Answer these before checking §4–6. Revisit after one day and one week; send corrections to Codex for the survey.
Question: Which system components enable useful large mixed-task training?
| Paper | Contribution | Best evidence | Reservation |
|---|---|---|---|
| MiMo-V2.6 (2026) | Scales rollout volume, environment/harness diversity, and grader compute with supporting infrastructure. | Figures 3, 7–11; Table 6. | One model family; internal benchmarks; limited component isolation. |
One reviewed paper is a starting point, not a cross-paper consensus. Next comparison: controlled ablations at a fixed rollout budget with public held-out evaluations.
Verify the PDF and version, store a copy, update the survey, and write a source-grounded brief with figures and a diagram seed.
Read with the brief in mind. Draw the causal or procedural map in draw.io from memory. Keep personal derivations in OneNote when helpful.
Send your corrected diagram, unanswered questions, and disagreements. Codex updates the brief and survey; revisit the recall prompts later.